2018 MLB All Star Break
Schedule
- Monday, July 16: Validating 538's ELO model
- Tuesday, July 17: Validating the winning probability model
- Wednesday, July 18: Validating the moneyline model
- Thursday, July 19: How much money will we make by betting on the favorites?
Over the course of the US 2018 Major League Baseball (MLB) All Star break (i.e. July 16-19), I will be releasing a daily video coding demo where I will assess the ability of different modeling approaches to predict the outcome of MLB games. The goal is to have some fun while learning about data analysis, reproducible research, and seeing if I can find a side hustle to help put my kids through college. I will be posting links to the videos along with links to the final commit for each day on the right side of this page. If you'd like to follow along, you will want to install R (v.3.5.0), R Studio (v.1.1.453), git (v.2.18.0), and make sure you have an account set up on GitHub.
As a fan of all things FiveThirtyEight, I am frequently suckered into their models for predicting who will win NCAA basketball tournaments, tennis majors, the Super Bowl, or the World Series. Many of us were also suckered into following their models and those of other news organizations in the lead up to the 2016 election. These models are probabilistic. This means that there is a model that calculates a probability that a candidate, player, or team will win a competition. The final FiveThirtyEight forecast for the 2016 US Presidential election predicted that Clinton had a 71% chance of winning. If the election were held in 1000 replicate universes, we would have expected her to win about 710 times. Needless to say that when the New York Times put her at an 85% chance of winning and the more cautious FiveThirtyEight model put her at 71% and she lost, the entire approach was thrown under the bus. There is a sense that the FiveThirtyEight model was more correct because it didn't seem like such a definitive probability. But we don't really know that because we don't know what happened in the 999 other parallel universes. Unless the probability is 0.000 or 1.000, we have a hard time definitively rejecting a model as being wrong.
In contrast to politics, there are considerably more data for sporting competitions than there are for elections. For example, a baseball team plays 162 games over the course of its regular season and there are 30 teams for a total of 2,430 games. Similarly, the NBA regular season has a total of 1,230 games, the NFL has 128 games, and the men's and women's NCAA tournaments have 68 and 64 games, respectively. Although it's not possible to play the same game 100 or 1,000 times, the large number of games played in a season should allow one to see how well a system predicts outcomes under a wide variety of conditions. Over the course of a baseball season, there will be a decent number of games where a the favorite has a 55% chance of winning. We could then determine the observed percentage of games a 55% favorite actually wins - is it near 55%? Sporting data is amazingly rich, complete, and open. For example, here is the box score for the oldest recorded Cubs game from May 8, 1871. Here's another from the 1932 World Series game between the Yankees and Cubs in which Babe Ruth supposedly called a home run off of Charlie Root (my maternal grandmother's second cousin. or something). Not only could we ask a question using data from the current season, but we could go all the way back to 1871.
The other thing about sports is that probabilistic models have a long history. Instead of telling people the probability that the Cubs will beat the Cardinals, bookmakers tell betters the payout for a $100 bet if they bet on either team. For example, if the betting line for the Cubs vs. the Cardinals puts the Cubs as a -110 favorite and the Cardinals as a +110 underdog, the probability of the Cubs winning will be 52% (i.e. 110/(110+100) = 52%). If I were to bet $110 on the Cubs and they won, then I'd net $100. If I instead bet $100 on the Cardinals and they won, I'd net $110. Of course, betting isn't a zero sum game. The bookie wants to make some money and people want to be rewarded by correctly taking a risk by betting on the underdog. This leads to an asymmetric betting line.
In the early 1980s, the guru of baseball statistics geeks, Bill James, developed a straightforward method of calculating the probability that a team would win based on the two teams' win-loss records.
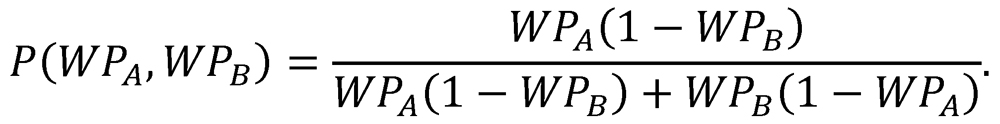
One would expect that a team with a higher win rate to be a favorite against a team with a lower win rate. Given a large amount of data suggesting that the home team wins 54% of its games and that getting your team's ace to go against the other team's number five pitcher should help sway the results of a game, this model, which only considers the two winning percentages, is amazingly simple. The derivation of the model does assume that the win percentages are based on a balanced schedule, i.e. that every team has played every team an equal number of times and that the game is played at a neutral site. At the end of opening day, half the teams have a win percentage of 1.00 and the other half have a win percentage of 0.00 and have only played a single game. Clearly, we don't have all of the information about a team until well into the season and there will be six games played at neutral sites for the 2018 season. Regardless, going back over nearly 150 years of data, James and other analysts have shown that this relatively simple model works pretty well.
Returning to FiveThirtyEight, they have also developed their own model based on ELO ratings. ELO ratings were originally developed for chess. A player's rating is determined by the ratings of the player's they have beaten and lost to. This information can then be used to establish a probability that a player will beat another player. Applied to baseball, FiveThirtyEight has set the average ELO rating across all baseball teams to be near 1500. Although the exact nature of the adjustments is not totally clear, if your team beats a team with a higher ELO rating, your team's ELO rating will move up more than if the opposing team had a lower ELO rating. Also, if your team loses to another team that has a lower ELO rating, your team's ELO rating will fall by a proportionate amount. To develop the ELO rating for the teams heading into each game, FiveThirtyEight adjusts each team's rating by adjusting for the effects of the home-field advantage, travel, rest, and the starting pitcher. There are a lot more parameters and assumptions in this model that the James-based win probability model.
To help flesh out these different modeling approaches, let's consider a recent game between the Cubs and Dodgers that was played in Los Angeles on June 25th. Going into the game, the Cubs' win percentage was 56% (42W-33L) and the Dodgers' was 54% (41W-35L). According to OddsPortal.com, the Dodgers were the favorite (-171) and the Cubs were the underdog (+148). If I were to bet $100 on the Cubs and they won, I would make an extra $148. This converts to a 63% probability of the Dodgers winning. By the win probability method, the Cubs were favored with a 52% win probability. FiveThirtyEight gave each team an ELO rating of 1554 and 1560, respectively. Both teams had fairly crummy pitchers on the mound resulting in deductions of 23 and 11 points. Also, the Cubs just finished a four game series in Ohio against the Reds and had to travel to LA while LA was finishing a three game series in New York against the Mets, but had home field advantage against the Cubs. This resulted in a 4 point deduction for the Cubs and a 20 point bonus for the Dodgers. Taking into account these adjustments, the Cubs had a pregame rating of 1527 and the Dodgers had a pregame rating of 1569. This resulted in a 56% chance of the Dodgers winning the game. That evening, the two teams squared off for the equivalent of November 8, 2016 - a one game test to see which model was better. The Dodgers won, 2-1. After this decision, the teams' ELO ratings changed two points to 1552 and 1562, respectively. According to these new ELO scores and adjustments, the Dodgers were a 54% favorite for the second game, while the Cubs' were the favorite based on win probability (51%). According to the bettors, the Dodgers were the favorites by a wider margin than ELO indicated at 62% (-164/+142).
Do these result show that the FiveThirtyEight and betting line models were better than the win percentage model? Of course not. Just like one electoral decision doesn't demonstrate that one news site's model is better than another. To answer that type of question, we need to consider the performance of the models over many games. In the subsequent game on June 26th, the Cubs actually beat the Dodgers. Of course, two games is insufficient as well - we need to look over many games, a full season, or go back to 1871. In addition to studying the performance at the end of the season, I would also like to know whether the performance of the three models (i.e. betting line, win probability, and ELO rating) change over the course of a season. The win probability model doesn't use any external data including the previous year's data, whereas the ELO rating bases a portion of their preseason ratings on the final records of the previous season. Another question I might ask is whether the wisdom of the masses that are baked into the betting lines "know" about these probabilistic models. In other words, if I were to bet $100 on the favorite for each game over the course of the season by the three models, how much money would I make or lose by the end of the season?
These questions may not interest you, but I think they are an interesting metaphor for political models. Because I'm a scientist interested in reproducible research methods, this exercise also serves as a metaphor for thinking about our own research practices. For instance, done well, these questions could help us to explore the value of open data, scripting code, and literate programming. Much of science is seen as "one and done". We do a study and it's done with little interest in repeating it. But with my baseball questions, I might want to see how the 2018 baseball season's data replicates the 2016 or 2017 data. Or I might want to apply my code to the 2017-2018 NBA or NFL seasons. Or I might want to replicate my analysis next week or tomorrow to track the performance of the models in real time. To me, reproducibility is about openness and the ability to use existing data and code to make a previous analysis more interesting and to easily bring in new data to see whether the results have changed with time. I think the questions I've outlined here serve as a good foundation for thinking about reproducibility in addition to the problem of model validation.